Ray Dalio’s The Changing World Order – Charts [All 112 Pages]

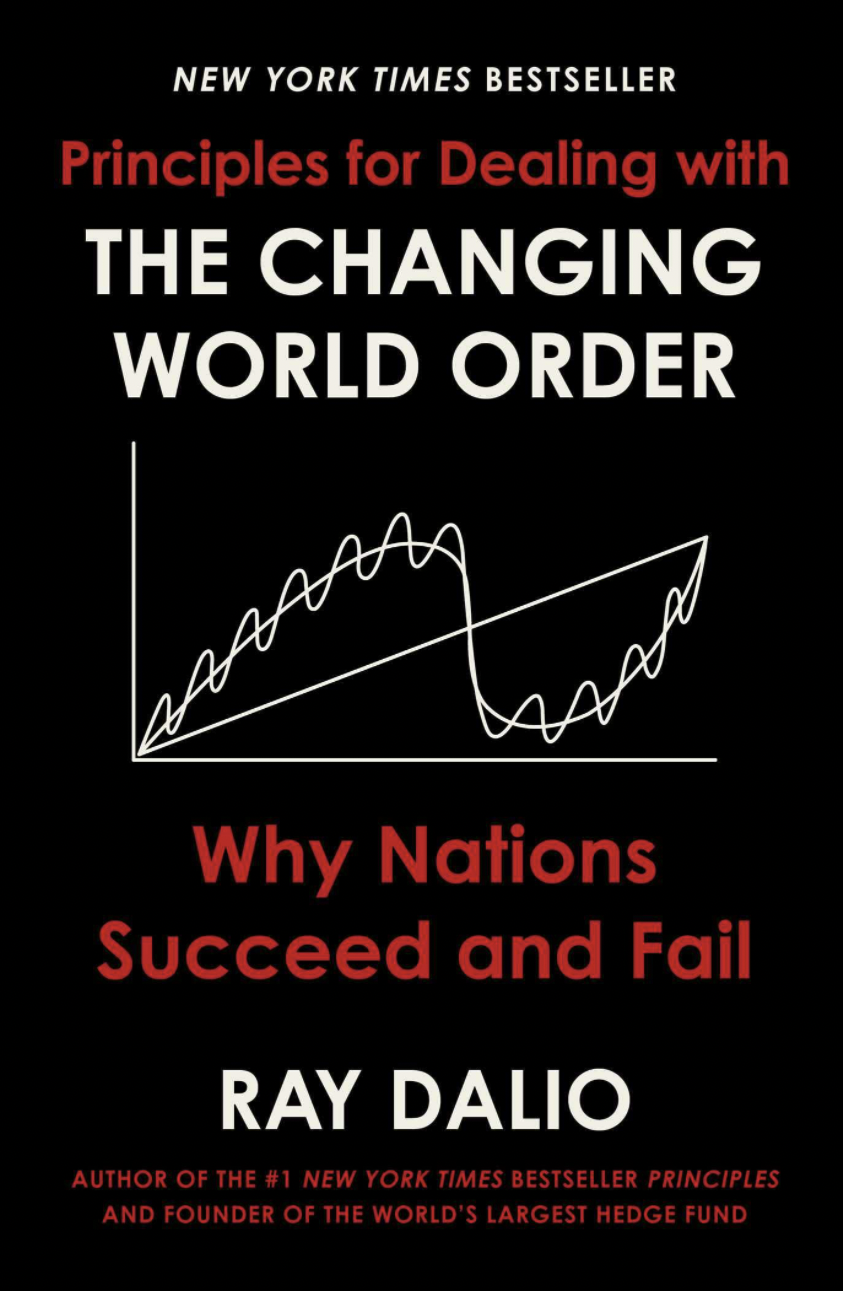
Ray Dalio’s The Changing World Order is an important book as the world undergoes fundamental changes economically, militarily, technologically, and geopolitically.

The book is filled with countless useful graphics, so presented below are all of them.

It’s also a great overall read in physical copy, which you can grab at a great price on Amazon.

Ray Dalio's The Changing World Order - Charts [All 112 Pages]


rough quantitative scoring of measures by stage in cycle


changes to the world order conceptual example


CHAPTER 2: THE DETERMINANTS

how the economic machine works


the three big cycles


dynamics to pay attention to


determinants addendum

CHAPTER 3: THE BIG CYCLE OF MONEY, CREDIT, DEBT, AND ECONOMIC ACTIVITY

types of monetary systems


CHAPTER 4: THE CHANGING VALUE OF MONEY

reserve currencies vs gold spot fx, spot fx vs gold


fx total return vs gold


spot fx vs gold 1913-1930, 1930-1950


spot fx vs gold 1966-1977


currency and gold real returns of major countries since 1850


real return of bills vs cpi


CHAPTER 5: THE BIG CYCLE OF INTERNAL ORDER AND DISORDER

china vs us changing world order


major chinese dynasties and their stages


global rgdp per capita


historical likelihood of internal conflict based on share of economic measures worse than threshold


internal conflicts civil wars over time


CHAPTER 6: THE BIG CYCLE OF EXTERNAL ORDER AND DISORDER

est european deaths from conflict


deu equity returns


equity return index usd


CHAPTER 7: INVESTING IN LIGHT OF THE BIG CYCLE

building blocks of a well-diversified portfolio


a look at asset returns across the great powers


share of portfolios losing x% over 5 years by country 60/40 portfolio real returns

For China and Russia, bond data pre-1950 is modeled using hard currency bond returns held as though hedged back to local currency by a domestic investor; stocks and bonds modeled as full default at time of revolution. Annualized returns assume a full 10-year period even if markets closed during the decade.


worst investor experiences across major countries

Cases of poor asset returns in smaller countries such as Belgium, Greece, New Zealand, Norway, Sweden, Switzerland, and across the emerg- ing world are excluded from this table. Note that for conciseness the worst 20-year window is shown for each country/time period (i.e., including Germany in 1903–23 precludes including Germany from 1915–35). For our 60/40 portfolios, we assumed monthly rebalancing across the 20-year window.


periods of wealth confiscation, periods of strict rising capital controls

While this diagram is not exhaustive, I include instances where I could find clear evidence of each occurring in the 20-year period. For this analysis, wealth confiscation was defined as extensive seizure of private assets, including large-scale forced, non-economic sales by a government (or revolutionaries in the case of revolution). Relevant capital controls were defined as meaningful restrictions on investors moving their money to and from other countries and assets (although this does not include targeted measures directed only at single countries, such as sanctions).


STOCK MARKET CLOSURES ACROSS MAJOR ECONOMIES


impact of taxes on rolling 20-year S&P total returns

Tax impact for 401(k) method applies a 26 percent income tax rate (effective average federal tax rate for top quintile from the Congressional Budget Office as of 2017) at the conclusion of each 20-year investment period (i.e., tax-free investment growth). Tax impact for brokerage method separately taxes dividends (at the same 26 percent income tax rate) and capital gains, paying taxes on all capital gains (at a 20 percent rate) from both principal and dividend reinvestment at the conclusion of each 20-year investment period and netting losses against any gains.


real return of bills vs cpi, gold returns during 60/40 drawdowns


real bond yield


nominal payback period


CHAPTER 8: THE LAST 500 YEARS IN A TINY NUTSHELL


book manuscript production in major european countries


rough count of tributary areas


CHAPTER 9: THE BIG CYCLE RISE AND DECLINE OF THE DUTCH EMPIRE AND THE GUILDER

netherlands index of key determinants


dutch arc 1550-1850


share of major inventions


dutch empire accomplishments


dutch major inventions


dutch east india co dividends


dutch standing relative to other great powers


dutch east india company balance sheet


bank of amsterdam holdings


dutch guilder value bank of amsterdam reserve ratio


dutch eic total returns by year of initial investment


dutch bond prices


CHAPTER 10: THE BIG CYCLE RISE AND DECLINE OF THE BRITISH EMPIRE AND THE POUND

changes to the world order


united kingdom uk index of key determinants


uk arc 1600 to present


great britain govt revenue 1600 to present


real gdp per capita 1400 to present


great britain share of world exports


share of global debt in gbp


uk wealth gap


share of world patent applications


warship tonnage


gbp fx vs gold


great britain current account gold reserves


average share of pounds in central bank reserves


uk per capita


CHAPTER 11: THE BIG CYCLE RISE AND DECLINE OF THE UNITED STATES AND THE DOLLAR

us index of key determinants


us arc 1750 to present


relative standing of great empires


us long rates short rates


private sector nonfinancial debt %gdp


us income shares wealth shares ideological positions of the major parties


share of congressional members votes cast along party lines


europe uk central bank balance sheets


japan balance sheet


CHAPTER 12: THE BIG CYCLE RISE OF CHINA AND THE RENMINBI

relative standing of great empire us china


china index of key determinants


transitions across different types of money in chinese history


cny vs usd


china's development since 1949 and 1978


united states and china education comparisons


CHAPTER 13: US-CHINA RELATIONS AND WARS

share of central bank reserves by currency


CHAPTER 14: THE FUTURE

global population


global life expectancy at birth


global real wealth per capita


global deaths by category


estimated deaths from conflict


debt burdens of leading powers reserve currency status


relative internal conflict gauge z-score


us internal conflict gauge breakdown


us-china conflict gauge


global deaths by category


number of natural catastrophic events


climate change vulnerability


empire score across major powers


real gdp growth estimate next ten years


APPENDIX: COMPUTER ANALYSIS OF THE CONDITIONS OF, AND PROSPECTS FOR, THE WORLD’S LEADING COUNTRIES

united states key drivers of our country power score


china key drivers of our country power score


eurozone key drivers of our country power score


germany key drivers of our country power score


japan key drivers of our country power score


india key drivers of our country power score


united kingdom uk key drivers of our country power score


france key drivers of our country power score


netherlands key drivers of our country power score


russia key drivers of our country power score


spain key drivers of our country power score

Software Blade

SoftwareBlade.com covers today's software and tomorrow's emerging technology.

Leave a Reply

Your email address will not be published. Required fields are marked *